


Sorry for the inconvenience.
Search again what you are looking for
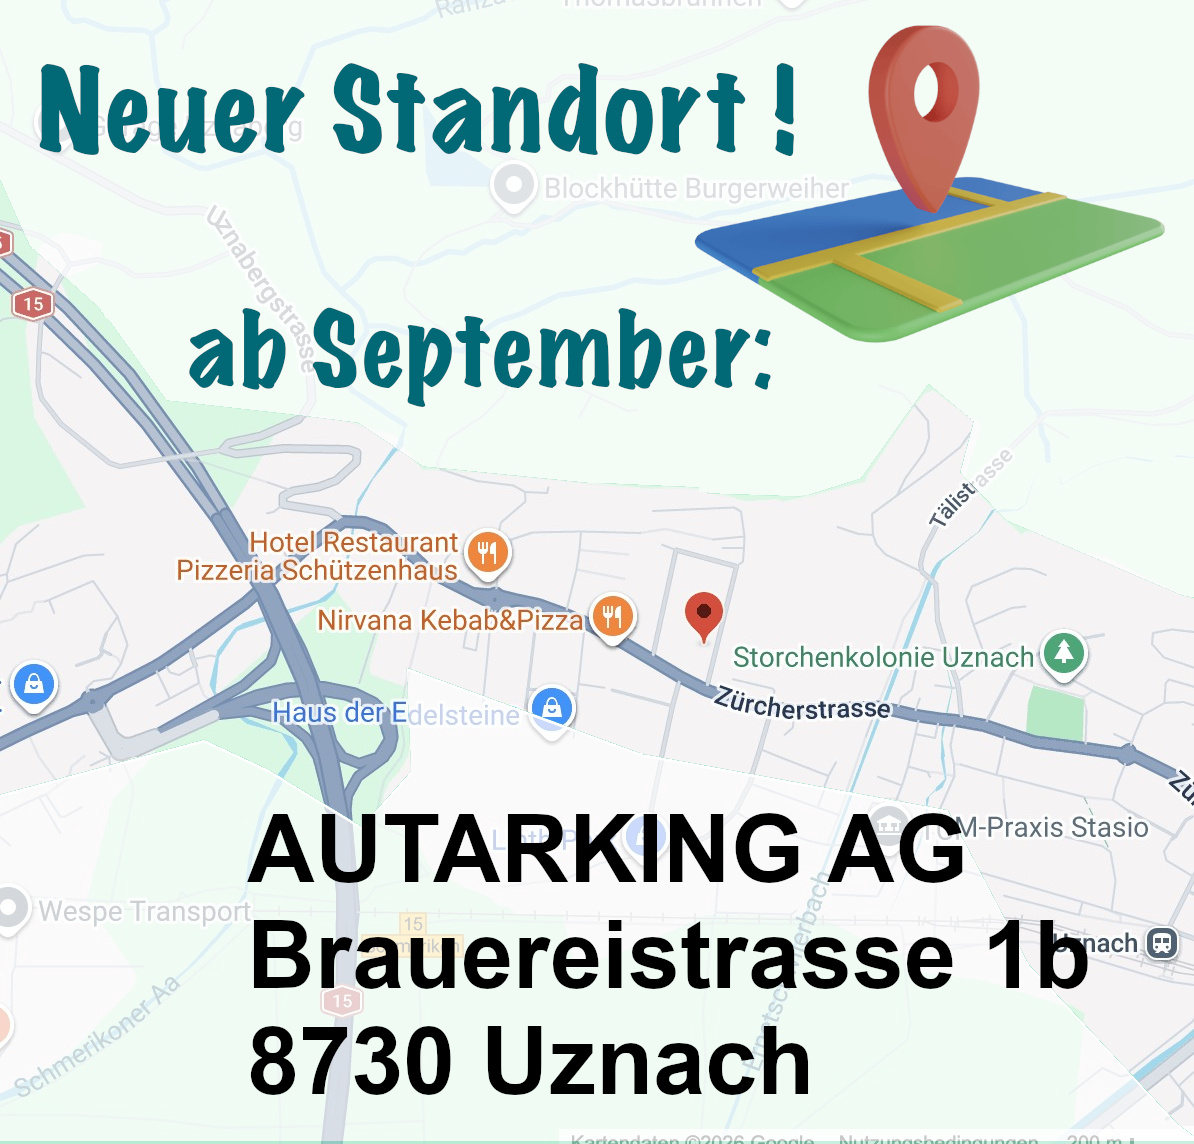
We're moving!
New address starting in September:
AUTARKING AG
Brauereistr. 1b
8730 Uznach
![]()

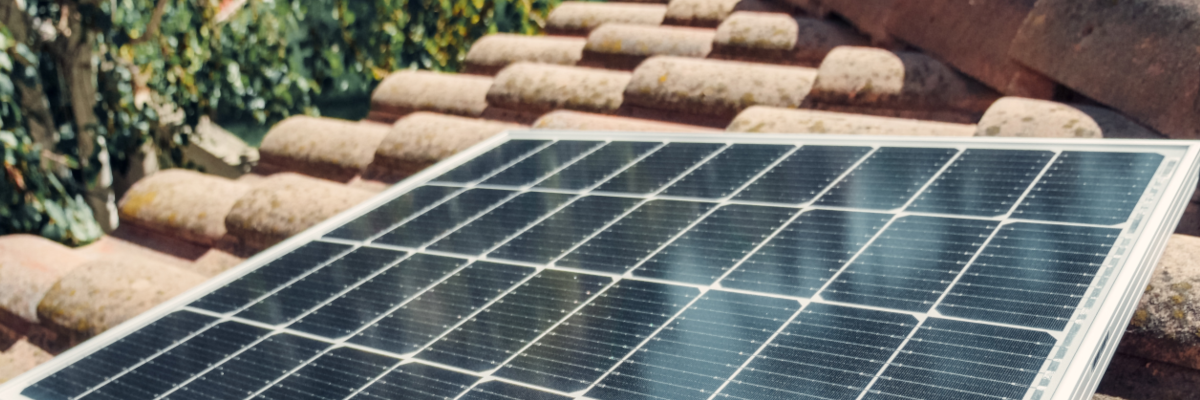
There are various approaches to estimating how much energy a solar panel / solar system delivers.
Depending on how precisely you want to know, a rule of thumb is often sufficient. We would like to explain these here. We also present two tools with which
the solar yield / solar radiation can be determined very precisely.
| Basically, you need to know that the sun is higher to the north and south of the equator in summer and lower in winter. The following graphic visualises this. | 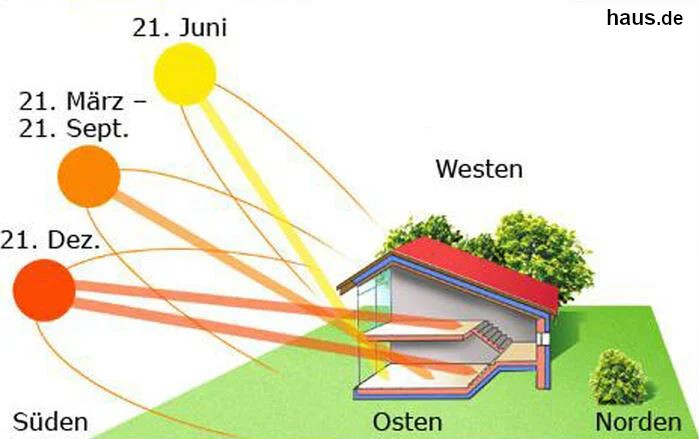 |
Furthermore, the installed panel area and the type of cells are of course decisive for the performance of the system and its yield. The output per area varies slightly depending on the cells used. It ranges between 190 and 200Wp / m2 |
|
| The orientation of the panel is also decisive for the yield. The following graphic provides information on this. | 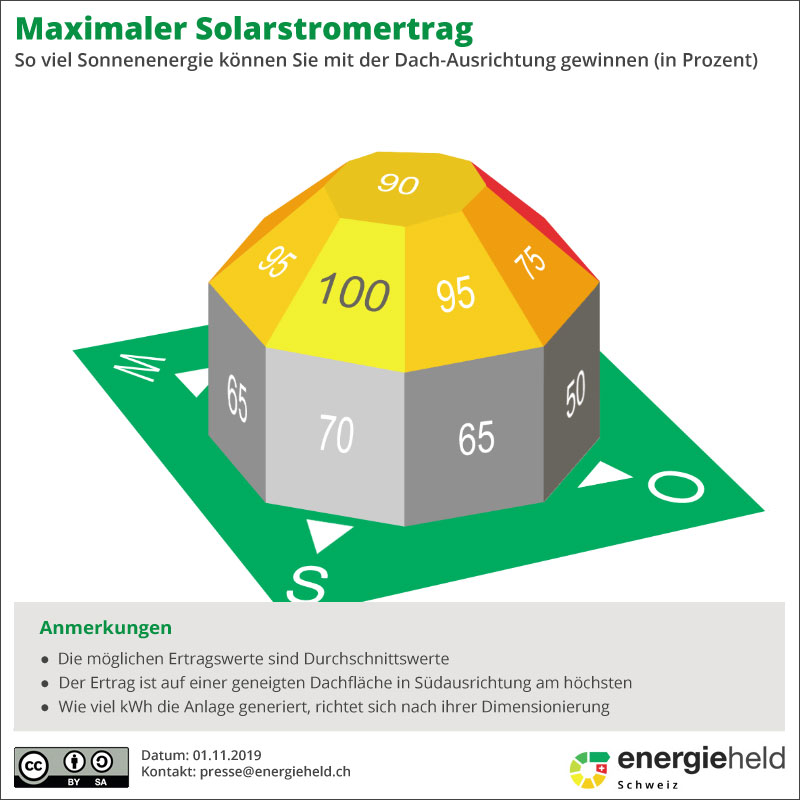 |
If the solar system is operated on a mobile basis, you will recognise that an exact calculation makes little sense as the conditions are constantly changing.
However, the rule of thumb gives you an idea of what you can expect.
Basically, the more hours of sunshine, the more energy. The closer to the equator and the more summer, the closer the system is to the sun and the more radiation hits the solar panel, which increases the yield.
In summer, we can use the following rule of thumb:
- In Central European latitudes, you can expect 3-4 times the installed power if the panel is not shaded and is mounted at a 45° angle to the south.
- In Southern Europe, you can expect 4-5 times the installed power if the panel is mounted at a 45° angle to the south In Southern Europe, 4-5 times the installed output can be expected if the panel is not shaded and is mounted at a 45° angle to the south.
- When approaching the equator, up to 5 - 5.5 times the installed output can be expected if the panel is not shaded and is mounted at a 45° angle to the south.
This means, for example:
2x 175Wp (350Wp) installed power results in a daily yield of approx. 1 - 1.2kWh in summer in Central Europe (x 3.5) or in a 12V system 80 - 96 Ah
Here's a visual overview: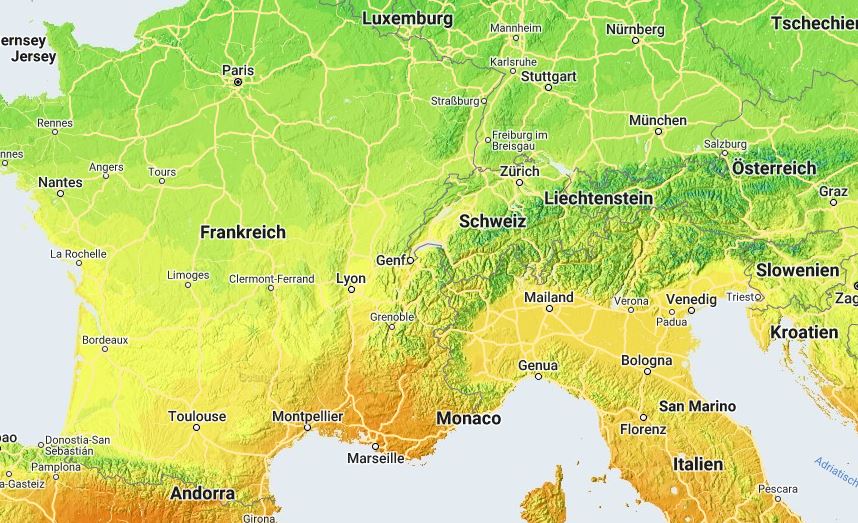
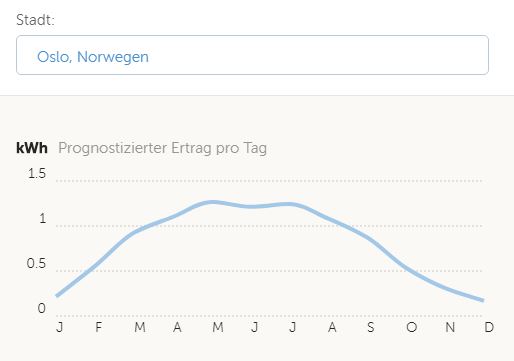
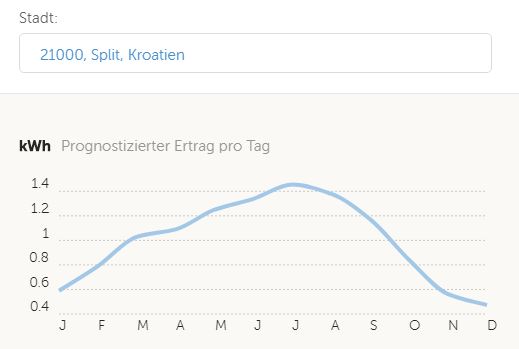
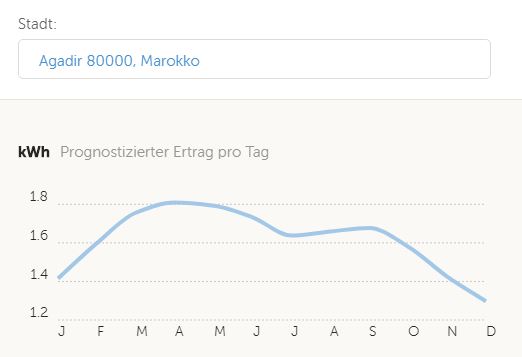
Victron Energy offers a tool for dimensioning solar controllers on its website. There you can also easily view the solar yield depending on the location as an annual graph for the desired output.
Here are three examples:
 |
 |
 |
||
| 350Wp in Oslo - Norway | 350Wp in Split - Croatia | 350Wp in Agadir - Morocco |
Victron Energy MPPT Solar Calculator
For example, the EU's PVGIS (Photovoltaic Geographic Information System) provides information on solar irradiance and photovoltaic (PV) power for any location in Europe and Africa, as well as large parts of Asia and the Americas.
The portal provides free and open access to:
- Power generation potential for various PV technologies and configurations
- Solar irradiance and temperature, as monthly averages or daily profiles.
- Complete time series of hourly values of solar irradiance and PV power.
- TMY data for nine climate variables, formatted for building energy calculation programs
- Application programming interface for fast, automated access needs
- Maps of solar resources and PV potential, by country or region, in ready-to-print files.
- PVMAPS, a software suite for users to create customised maps
PVGIS uses high quality, high spatial and temporal resolution solar irradiance data obtained from satellite imagery, as well as ambient temperature and wind speed from climate analysis models.
The PVGIS energy yield model is validated against measurements taken on commercial modules at the JRC's European Solar Test Facility (ESTI). ESTI is an ISO 17025 accredited photovoltaic calibration laboratory for all photovoltaic materials.
Disclaimer
The designations employed and the presentation of the material on the maps do not imply the expression of any opinion whatsoever on the part of the European Union concerning the legal status of any country, territory, city or area or of its authorities, or concerning the delimitation of its frontiers.
Original Link: EU Science Hub
Search again what you are looking for